 |
My research objectives are to explore 3D interaction and 3D visualization.
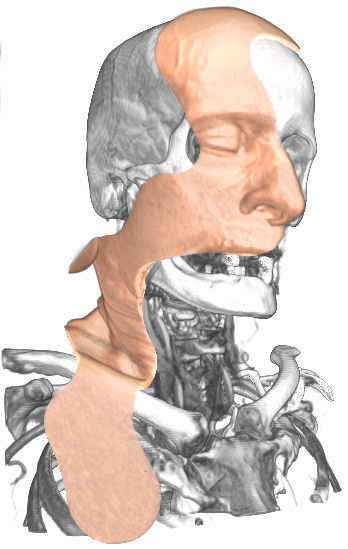
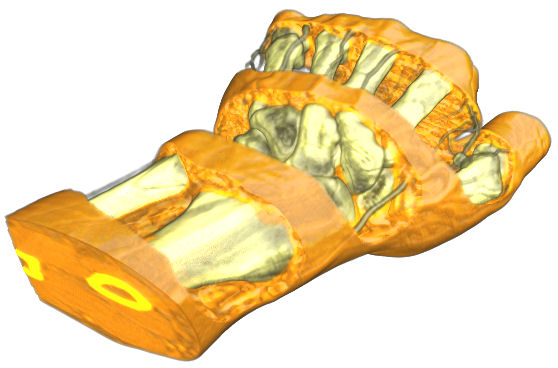
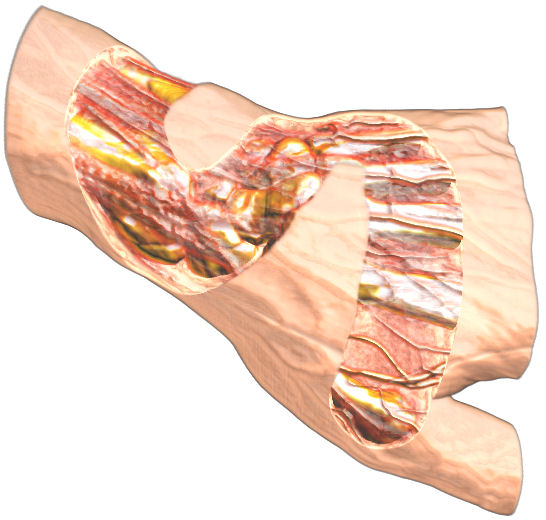
The practical goal from this exploration is the creation of intuitive, real-time, interactive visual exploration, manipulation, and selection algorithms for 3D data and in 3D immersive virtual environments. These interactive visualization algorithms should be extremely easy to use, self-descriptive, aesthetically pleasing, should engage the user, and be underpinned by powerful data representation models and GPU-based data processing algorithms. To make effective use of all the available data in various applications, users must be able to quickly and effortlessly focus on and manipulate features of interest, while maintaining contextual views. This capability will be supported, in part, by exploring and realizing interaction metaphors that provide high-level access methods allowing users to interact with the data using virtual analogies of familiar real-world actions. Examples of such interaction metaphors include cutting, pushing/pulling, painting, sliding, folding, and sketching. These "natural" input actions will be translated by the software into meaningful and efficient operations on the data, resulting in deeper insight.
 |
 |
 |
 |
The novelty of this work lies in the synthesis of state-of-the-art computer graphics and GPU-based data processing algorithms, recent and/or original interaction models (such as sketching), and modern input and display devices, all of which must be seamlessly woven together to create highly effective interactive data visualization systems.